
Table of Contents
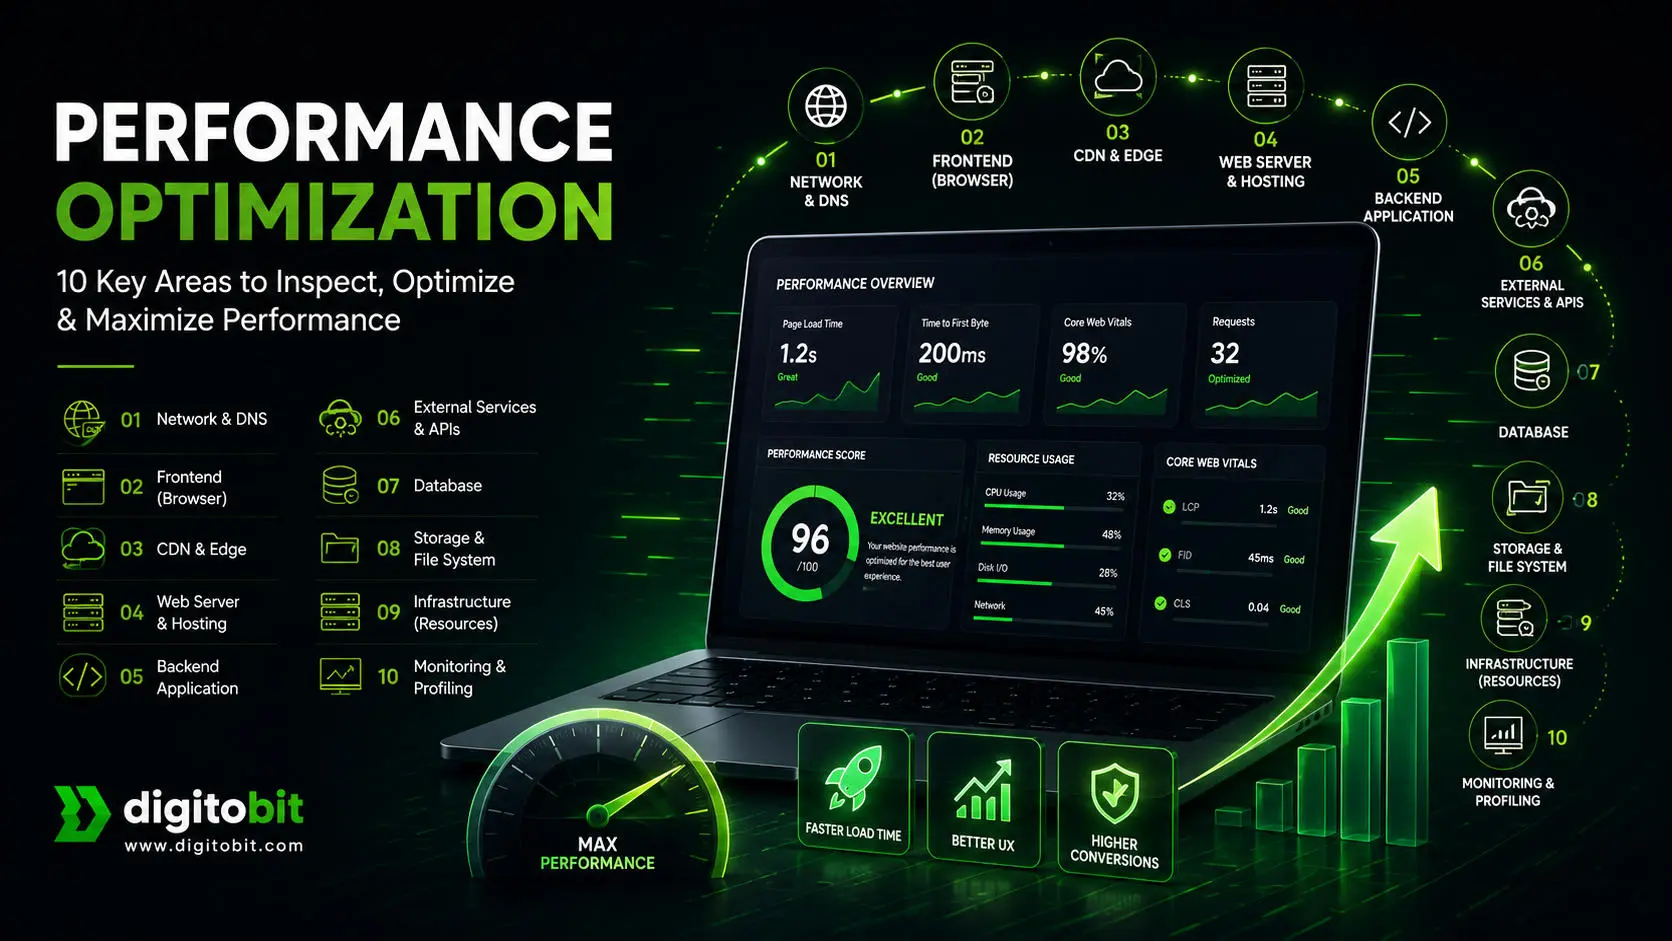
- Introduction
- Start with Measurement, Not Assumptions
- The Request Journey
- Performance Investigation Checklist
- Tools for Diagnosing Each Stage
- Real-World Optimization Workflow
- Conclusion
Introduction
In today’s digital world, speed is no longer a luxury—it’s an expectation. Whether it’s a business website, an e-commerce platform, a SaaS application, or an enterprise system, users expect pages to load instantly and interactions to feel seamless. Even a delay of a few hundred milliseconds can negatively impact user satisfaction, reduce engagement, lower search engine rankings, and ultimately affect revenue. As applications grow in complexity, maintaining consistent performance becomes one of the most important responsibilities of software architects and engineering teams.
When users report that an application is “slow,” the immediate assumption is often that the server lacks resources or the code needs optimization. In reality, application performance is influenced by an entire chain of interconnected systems working together to process every request. Before a user sees a webpage or receives an API response, the request passes through DNS resolution, network infrastructure, content delivery networks, web servers, backend services, databases, storage systems, external APIs, and finally returns to the client for rendering. A slowdown in any one of these layers can become the bottleneck that limits the performance of the entire system.
This guide presents a practical framework for analyzing application performance across ten critical stages of the request lifecycle. Rather than focusing on isolated optimization techniques, it explains how to identify potential bottlenecks in networking, frontend rendering, content delivery, hosting environments, backend applications, external services, databases, storage systems, infrastructure, and monitoring. Understanding the role of each layer provides a solid foundation for diagnosing performance issues with confidence and implementing targeted improvements where they matter most.
Start with Measurement, Not Assumptions
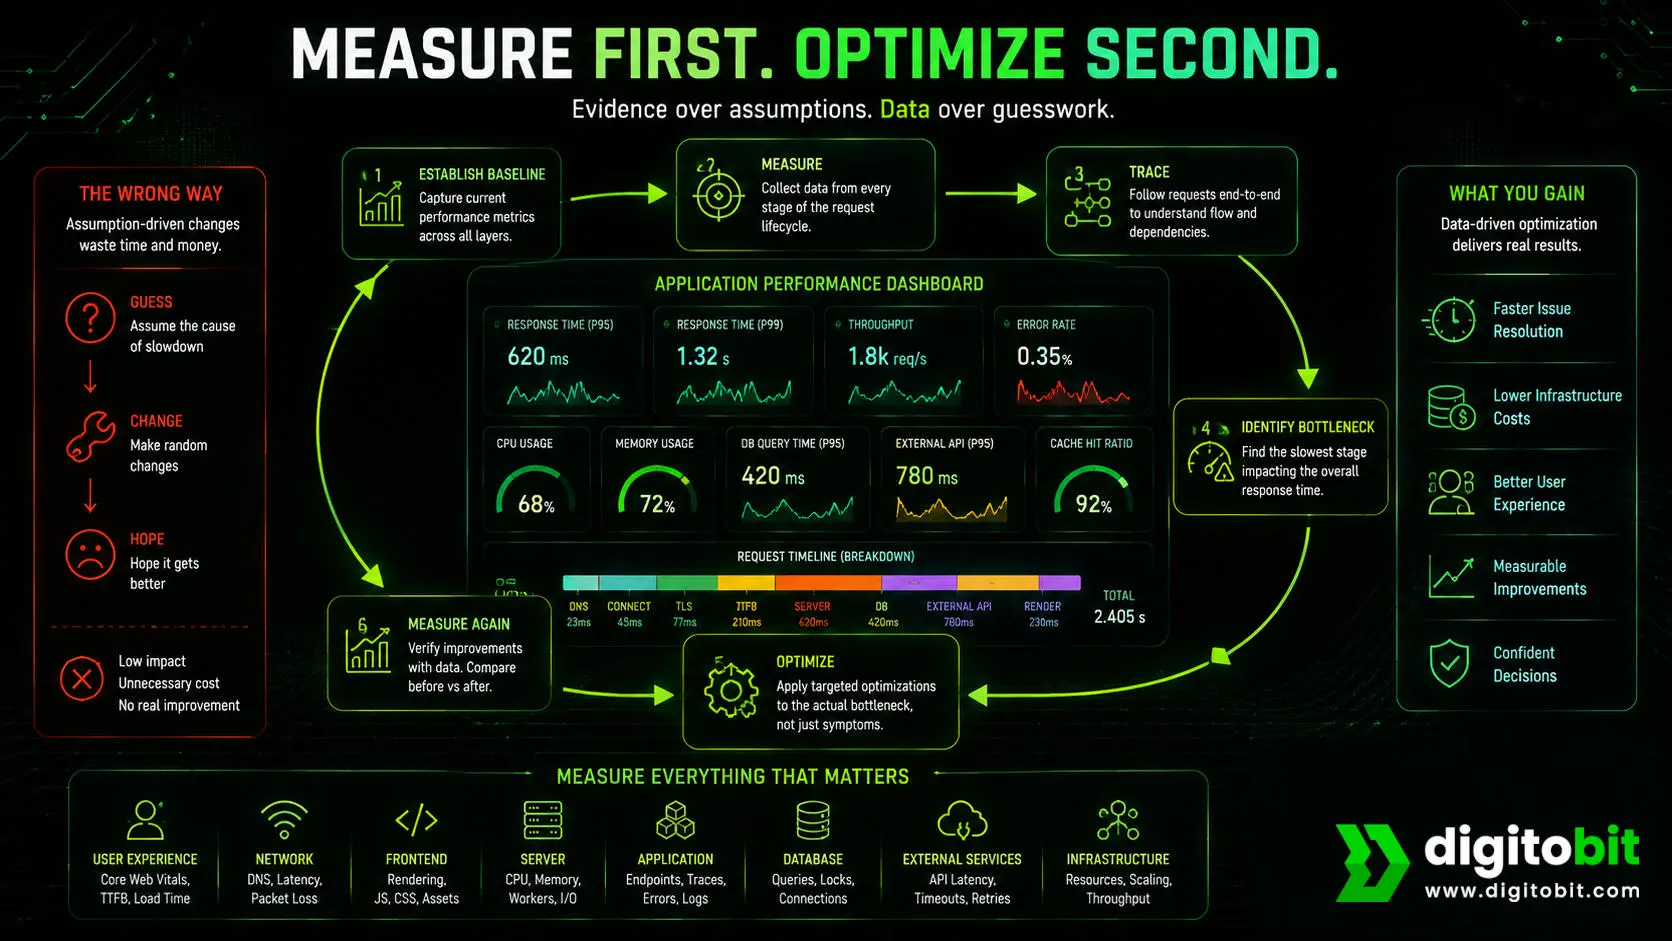
One of the most common mistakes during performance optimization is jumping directly to solutions without first understanding the problem. Developers may upgrade hosting plans, add caching layers, rewrite application code, or optimize database queries based on assumptions rather than evidence. While these changes may improve performance in some cases, they often consume valuable time and resources without addressing the actual cause of the slowdown. Effective optimization begins with measurement, not modification.
A structured investigation allows engineers to isolate performance issues systematically instead of relying on trial and error. By examining each stage of the request lifecycle independently, it becomes possible to identify where time is being spent, distinguish between symptoms and root causes, and prioritize optimizations that deliver the greatest impact. This method not only reduces troubleshooting time but also prevents unnecessary architectural changes and infrastructure costs.
One of the biggest mistakes in performance optimization is assuming the cause of a slowdown without first collecting evidence. A slow application does not necessarily indicate inefficient code, a slow database, or inadequate hosting. The actual bottleneck may exist anywhere along the request lifecycle, from DNS resolution and network latency to frontend rendering or third-party API responses. Making changes based on assumptions often leads to unnecessary code rewrites, infrastructure upgrades, or configuration changes that fail to improve the user experience. Effective optimization begins with establishing a performance baseline, measuring response times at every stage, and identifying the component responsible for the delay. Once the true bottleneck has been isolated, optimization efforts become focused, measurable, and far more likely to produce meaningful results.
The Request Journey
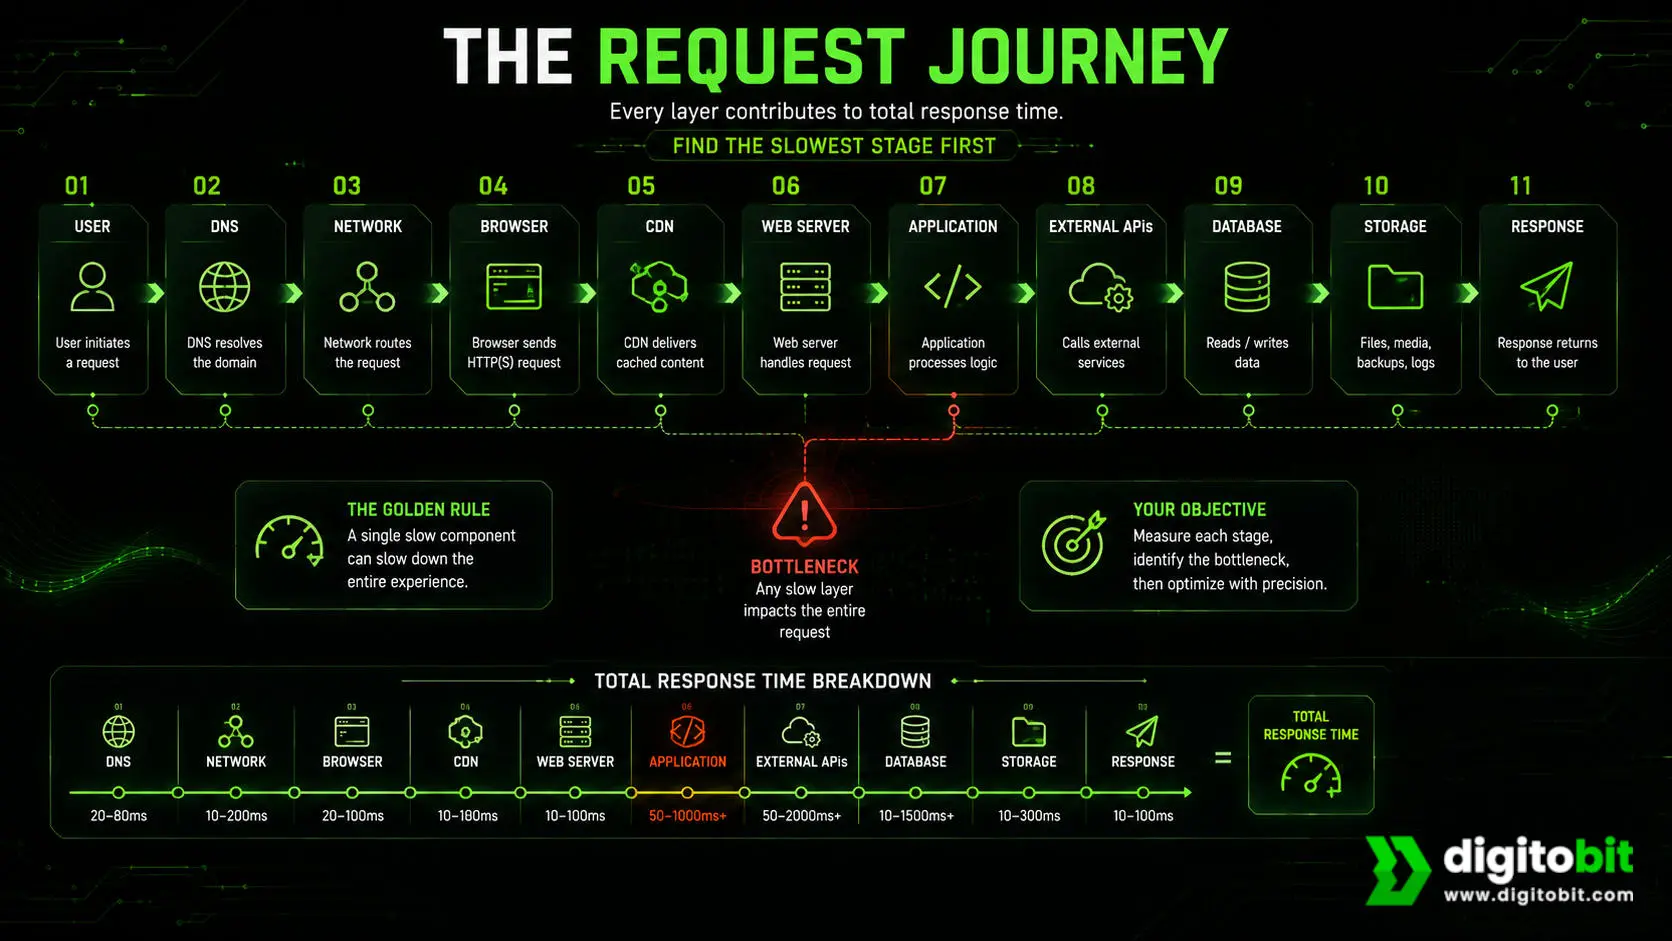
Before optimizing, it’s important to understand the path every request follows.
User
│
▼
DNS
│
▼
Network
│
▼
Browser
│
▼
CDN
│
▼
Web Server
│
▼
Application
│
▼
External APIs
│
▼
Database
│
▼
Storage
│
▼
Response
Every component contributes to the total response time.
The objective is simple:
Find the slowest stage before attempting to optimize it.
Performance Investigation Checklist
1. Network & DNS
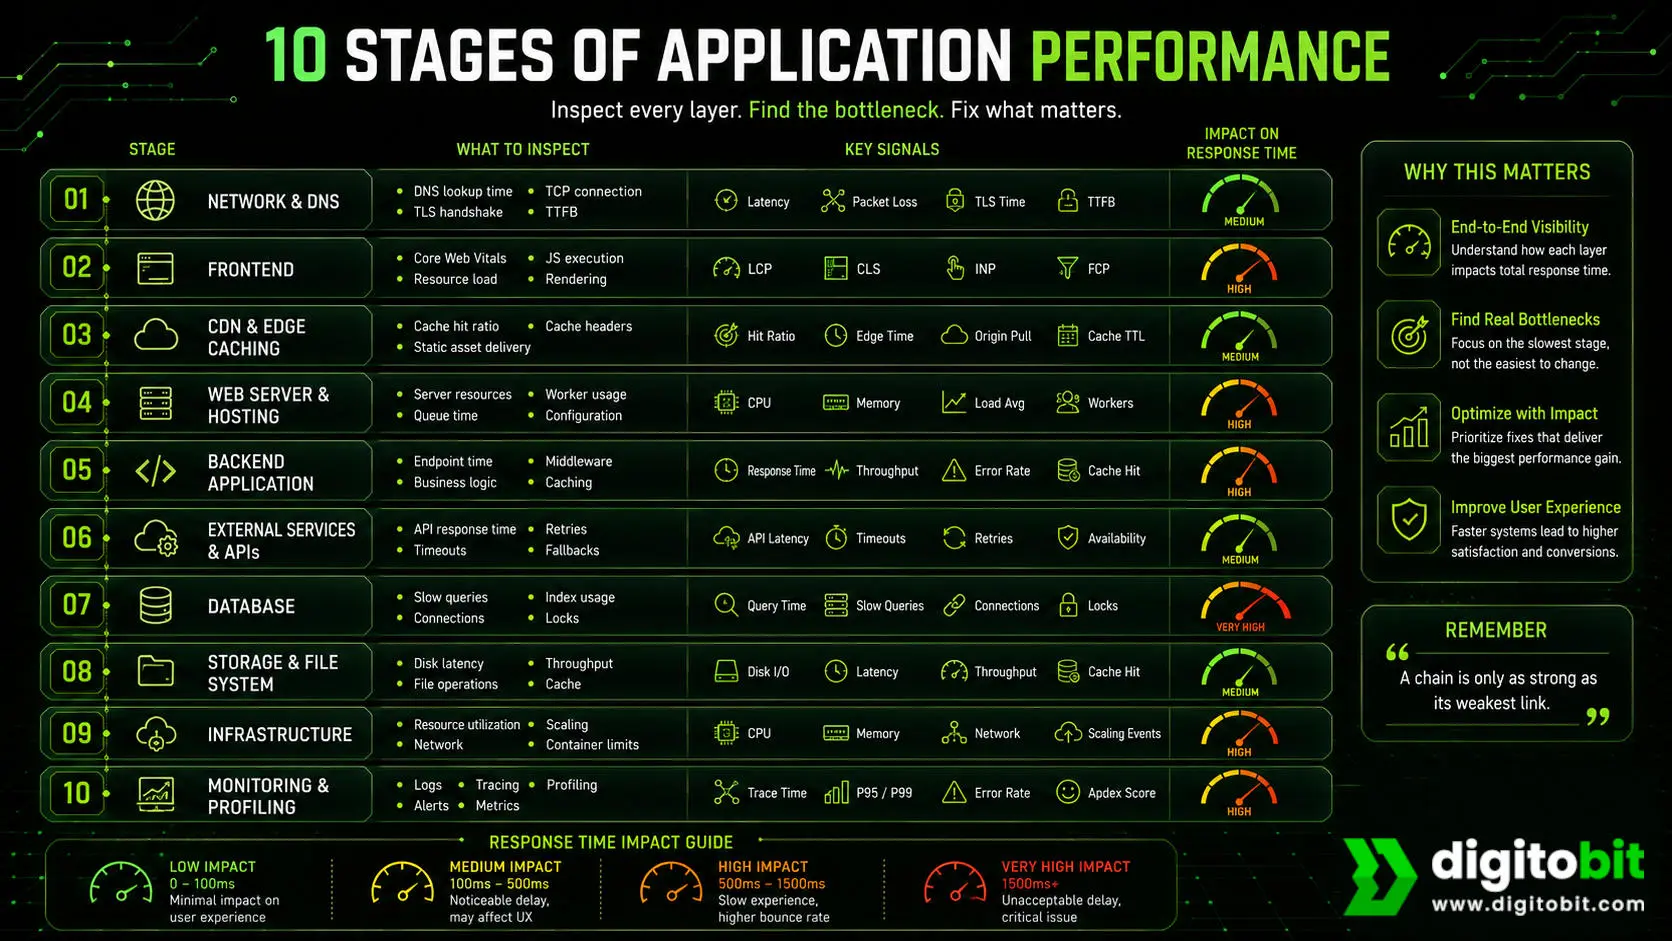
Every request begins long before your application receives it. The browser must first resolve your domain name through the Domain Name System (DNS), establish a network connection, and complete the SSL/TLS handshake before any data can be exchanged. Although these steps typically take only a fraction of a second, poor DNS providers, high network latency, inefficient routing, or slow TLS negotiation can noticeably delay the initial response. Since these operations occur before your application code executes, they are often overlooked when diagnosing performance issues.
Typical bottlenecks
- Slow DNS resolution
- High latency
- Packet loss
- Missing HTTP/2 or HTTP/3
- Poor TLS configuration
- Long SSL handshake
- Wrong geographic routing
Things to inspect
- DNS lookup time
- TCP connection time
- TLS negotiation
- TTFB (Time To First Byte)
2. Frontend
Once the browser receives the response, it begins downloading and rendering HTML, CSS, JavaScript, fonts, images, and other assets. A fast backend cannot compensate for a slow frontend if users must wait for large JavaScript bundles, render-blocking resources, or unoptimized media. Efficient frontend performance focuses on minimizing downloads, prioritizing critical resources, reducing rendering work, and delivering a responsive experience across devices and network conditions.
Typical bottlenecks
- Large JavaScript bundles
- Render-blocking CSS
- Unoptimized images
- Too many fonts
- Excessive DOM size
- Layout shifts
- Too many HTTP requests
Google’s Core Web Vitals provide standardized metrics for assessing loading performance, visual stability, and interaction responsiveness.
Things to inspect
- LCP
- CLS
- INP
- FCP
- JS execution time
- CSS rendering
- Lazy loading
3. CDN & Edge Caching
Content Delivery Networks (CDNs) distribute static assets across geographically dispersed edge servers, allowing users to retrieve content from locations closer to them rather than from the origin server. Properly configured HTTP caching significantly reduces latency, bandwidth consumption, and server load. However, ineffective cache policies, low cache hit rates, or incorrect cache invalidation can prevent the CDN from delivering its full performance benefits, forcing requests back to the origin server unnecessarily.
Typical bottlenecks
- Cache misses
- Static files not cached
- Wrong cache headers
- CDN not enabled
- Origin server overloaded
Things to inspect
- Cache hit ratio
- CDN response headers
- Static asset delivery
4. Web Server & Hosting
The web server acts as the gateway between incoming client requests and your application. Whether running on shared hosting, a virtual private server, or cloud infrastructure, the hosting environment determines how efficiently requests are accepted, queued, and forwarded. Limited CPU resources, insufficient memory, overloaded web server workers, slow disk access, or poorly configured server software can create bottlenecks even before the application begins processing the request.
Typical bottlenecks
- Shared hosting overload
- CPU saturation
- Memory exhaustion
- Disk I/O
- PHP-FPM workers
- Apache/Nginx configuration
- Too many concurrent requests
Things to inspect
- CPU usage
- RAM usage
- Load average
- Response queue
- Worker utilization
5. Backend Application
The backend contains the business logic that processes requests, validates data, communicates with other services, and generates responses. As applications grow in complexity, inefficient algorithms, unnecessary computations, excessive object creation, synchronous operations, and poor caching strategies can increase response times considerably. Careful profiling and code optimization ensure that the application performs only the work necessary to fulfill each request as efficiently as possible.
Typical bottlenecks
- Inefficient business logic
- Excessive loops
- Blocking operations
- Large payload generation
- Session locking
- Poor caching strategy
Things to inspect
- Endpoint execution time
- Slow controllers
- Middleware
- Cache utilization
- Memory allocation
6. External Services & APIs
Modern applications rarely operate in isolation. Payment gateways, authentication providers, mapping services, email platforms, AI models, and numerous third-party APIs often become integral parts of the request lifecycle. Since these services operate outside your infrastructure, their response times directly affect your application’s performance. Network delays, rate limits, service outages, and slow external dependencies should always be considered when investigating inconsistent or unexpectedly long response times.
Typical bottlenecks
- Slow payment gateways
- Email APIs
- Authentication providers
- Third-party REST APIs
- AI services
- Geolocation APIs
Things to inspect
- API response time
- Retry frequency
- Timeout settings
- Circuit breakers
- Fallback strategy
7. Database
The database is responsible for storing, retrieving, and updating application data, making it one of the most common sources of performance bottlenecks. Poorly designed queries, missing indexes, excessive joins, lock contention, and inefficient data models can dramatically increase execution time. As datasets grow, operations that once completed instantly may become increasingly expensive, highlighting the importance of efficient schema design, indexing strategies, and continuous query optimization.
Typical bottlenecks
- Missing indexes
- N+1 queries
- Table scans
- Lock contention
- Inefficient joins
- Excessive connections
- Poor schema design
Things to inspect
- Slow query log
- EXPLAIN plans
- Query execution time
- Index usage
- Connection pool
- Deadlocks
8. Storage & File System
Applications frequently interact with local or remote storage for uploads, downloads, image processing, logging, backups, and document generation. Slow disks, network-attached storage latency, excessive file operations, or inefficient handling of large files can negatively impact both response time and server throughput. Optimizing storage access patterns and reducing unnecessary disk operations can significantly improve overall application performance.
Typical bottlenecks
- Slow disk
- Large file reads
- Image processing
- File uploads
- Log growth
- Backup processes
Things to inspect
- Disk latency
- Read/write throughput
- File cache
- Storage utilization
9. Infrastructure
Beyond the application itself, the underlying infrastructure determines how effectively workloads are supported. CPU capacity, memory availability, network bandwidth, virtualization overhead, container resource limits, and auto-scaling policies all influence system responsiveness under varying levels of demand. Infrastructure bottlenecks often become visible only during periods of increased traffic, making proactive monitoring and capacity planning essential for maintaining consistent performance.
Typical bottlenecks
- CPU bottleneck
- Memory bottleneck
- Disk bottleneck
- Network bandwidth
- Autoscaling issues
- Container limits
- Virtualization overhead
Things to inspect
- Resource utilization
- Container metrics
- Scaling events
- Network throughput
10. Monitoring & Profiling
Performance optimization should always be driven by measurable data rather than assumptions. Comprehensive monitoring and profiling provide visibility into response times, resource utilization, slow queries, error rates, and application behavior across every layer of the system. By collecting meaningful metrics and tracing requests end-to-end, teams can accurately identify bottlenecks, prioritize improvements, and verify that each optimization delivers measurable performance gains.
Typical bottlenecks
- Lack of observability
- No tracing
- Missing metrics
- Hidden slow endpoints
Things to inspect
- Application logs
- Distributed tracing
- Performance profiling
- Error rates
- Response time percentiles (P95/P99)
Tools for Diagnosing Each Stage
Accurate diagnosis requires visibility into every layer of the application stack. Lighthouse and Browser developer tools help analyze network requests, rendering performance, and frontend metrics such as Core Web Vitals. Network utilities can measure DNS resolution, latency, and connection quality, while CDN analytics reveal cache efficiency and content delivery performance. On the server side, application profilers, log analyzers, and APM (Application Performance Monitoring) solutions provide insights into request execution, memory usage, and slow transactions. Database tools expose inefficient queries, execution plans, and indexing issues, while infrastructure monitoring platforms track CPU, memory, storage, and network utilization. No single tool can diagnose every performance problem; instead, engineers should combine measurements from multiple sources to build a complete picture of how requests flow through the system and where delays originate.
Real-World Optimization Workflow
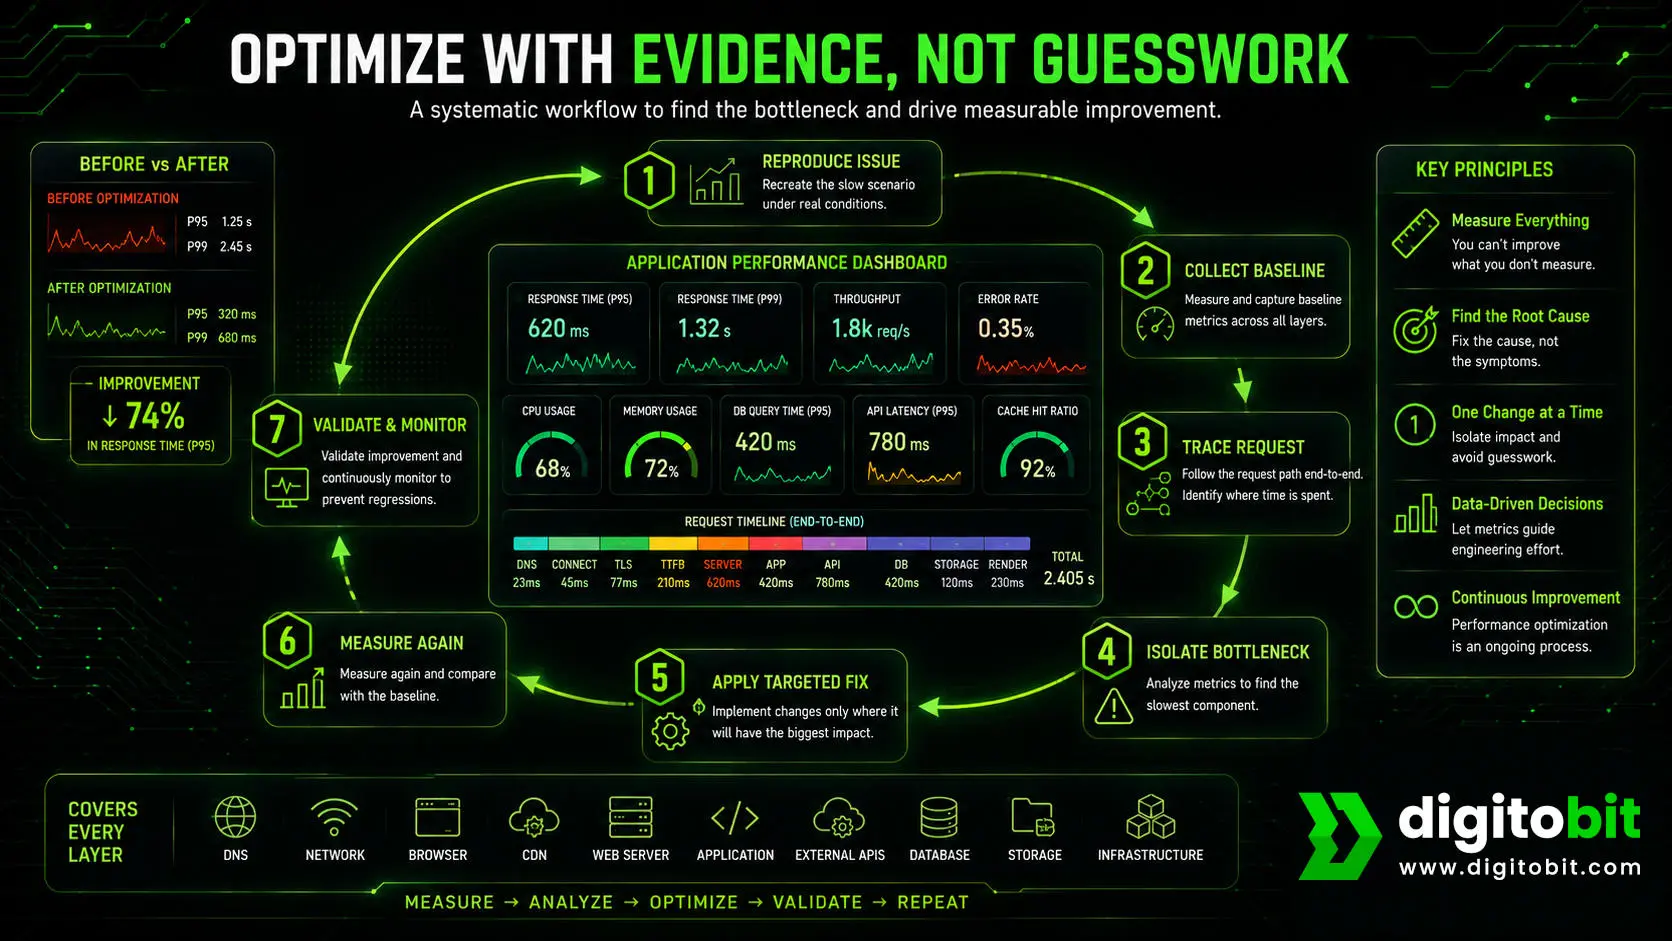
A systematic optimization workflow minimizes guesswork and ensures that engineering effort is focused where it delivers the greatest value. The process begins by reproducing the performance issue under controlled conditions and collecting baseline metrics. Each stage of the request lifecycle is then examined independently, starting with DNS and networking, followed by frontend rendering, CDN performance, web server configuration, backend execution, external service dependencies, database operations, storage systems, and infrastructure resources. Once the primary bottleneck has been identified, targeted optimizations should be implemented incrementally rather than making multiple changes simultaneously. After each optimization, performance should be measured again to verify its impact before proceeding to the next stage. This iterative approach not only prevents unnecessary work but also ensures that every improvement is supported by measurable evidence, resulting in applications that remain fast, reliable, and scalable as they evolve.
Conclusion
Performance optimization is not about making every part of an application faster—it is about identifying and improving the component that currently limits overall system performance. A highly optimized database cannot compensate for slow DNS resolution, just as a powerful server cannot overcome inefficient frontend rendering or delayed responses from external APIs. Every layer in the request lifecycle contributes to the user’s experience, and the slowest stage ultimately determines the application’s responsiveness.
Successful optimization requires a disciplined, evidence-driven approach. Instead of relying on assumptions or immediately applying popular performance techniques, engineers should begin by measuring each stage of the request path, collecting meaningful metrics, and understanding where delays actually occur. Modern profiling tools, monitoring platforms, browser developer tools, and infrastructure metrics provide valuable insights that make it possible to isolate bottlenecks accurately and validate the effectiveness of every optimization.
As applications evolve, performance optimization should become an ongoing engineering practice rather than a one-time task performed only when problems arise. New features, increasing traffic, larger datasets, changing user behavior, and additional third-party integrations continuously alter system performance. Regular monitoring, periodic performance reviews, and proactive capacity planning help ensure that applications remain fast, reliable, and scalable as they grow.
Ultimately, great-performing software is rarely the result of a single optimization or a more powerful server. It is the outcome of thoughtful architecture, efficient implementation, continuous measurement, and informed decision-making across every layer of the technology stack. By adopting a systematic approach to investigating bottlenecks, development teams can build applications that not only perform well today but continue to deliver exceptional user experiences as business demands evolve.

Author: Neeraj Mourya
Founder, Systems Architect – Digitobit
Specializing in scalable backend architecture and performance-focused SaaS systems